UBC Civil Engineering researchers say the e-bikes are alright
Metro Vancouver can safely integrate most new electric-powered mobility devices, study finds
Love them or hate them, new mobility devices like e-bikes are here to stay.
In one of the first large-scale studies to measure the real-world usage of these devices, UBC transportation researchers found that most other road users are comfortable sharing cycling lanes and off-street paths with these new modes of transport—despite some misperceptions of how fast these devices are actually going.
Take electric bikes, currently enjoying a boom in Metro Vancouver and other cities.
“Many people like electric bikes but others worry that they travel at high speeds, although in reality they don’t – at least not according to the observations in our study,” says UBC researcher Amir Hassanpour, a PhD student in transportation engineering in the faculty of applied science.
“Many of the people we surveyed thought electric bikes 4 km/hr faster than they actually do, but in fact most of the e-bikes we saw were actually travelling well below the speed limit of 32 km/hr,” says Hassanpour.
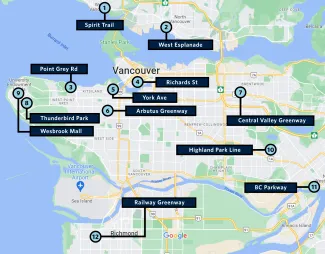
Hassanpour and his colleagues set up observation stations at 12 locations across Metro Vancouver—installing GoPro cameras and laying pneumatic tubes on the road to count vehicles and determine vehicle types and speeds. They also conducted a survey to determine how comfortable path users (including pedestrians and people on conventional and electric-powered devices) felt while using the same roads and trails.
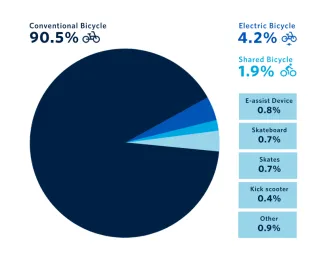
One major misperception was that the surveyed path users believed that electric-assist devices were three times more prevalent than they actually were. Hassanpour chalks up these perceptions to the fact that e-bikes are relatively new, so we remember them more vividly and start thinking they’re more prevalent than they actually are. “It’s what’s called a frequency illusion—once you encounter a new emerging vehicle, all of a sudden you see it everywhere.”
These mental biases could also affect perceived speed, he theorizes. In fact, average speeds for electric-assist devices were around 20-22 km/hr, only slightly faster than conventional bicycles.
The UBC camera stations observed more than 25,000 vehicles representing 25 different mobility devices ranging from pedal bikes, push scooters and roller skates to moped-style scooters and even golf carts.
Their findings—published today for the first time—paint an image of relative comfort and safety for users of these shared paths and bike lanes.
“Most people – despite overestimating others’ speeds – reported feeling relatively comfortable using the shared paths, with low levels of negative interactions or actual conflict and injury,” says Hassanpour. “The one outlier is motorized sit-down scooters, or mopeds, which people consider more dangerous than other electric-assist devices, probably because they are significantly larger and heavier as well as faster.”
The good news, according to UBC transportation expert Dr. Alex Bigazzi, an associate professor of civil engineering and planning who supervised the study, is that the findings support policies to legalize a wider array of new mobility devices.
“Cycling facilities and multi-use paths can comfortably accommodate a wider range of devices than we expected. At the same time, we should continue to set speed limits for these devices along with other constraints. We should also work to eliminate sit-down e-scooters from bicycle lanes and multi-use paths.”
The report does recommend a few changes including separating pedestrians from other path users on facilities that allow electric-assist devices, once traffic reaches a certain level.
“We believe that this work can supply vital information to enable us to design better cycling facilities as the demand for them grows,” adds Dr. Bigazzi.
The study was funded by TransLink’s New Mobility Lab. This article originally appeared on UBC News.