Marginalized groups experience higher cumulative air pollution in urban Canada
January 8, 2021
Edited: June 27, 2022
Different marginalized groups are exposed to higher cumulative air pollution in Vancouver, Montreal and Toronto, according to new research from the University of British Columbia.
The study, published in Environmental Research Letters (2020), shows that in Vancouver, Indigenous residents are most at risk, while the burden falls on immigrant and low-income residents in Montreal and Toronto, respectively.
The study is an illustrative analysis for 2012. By considering how exposure to air pollution overlaps with various socio-demographics, the study reveals unique patterns of risk.
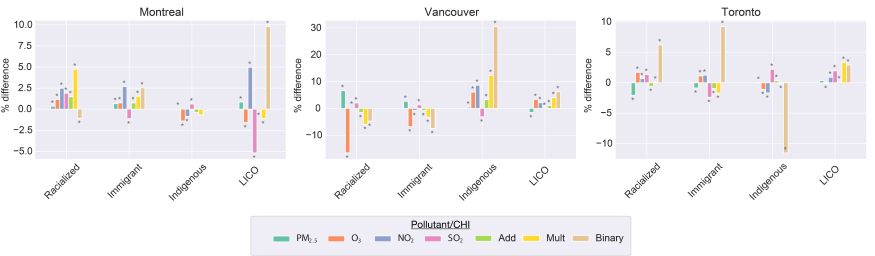
“If you look at visible minorities as one uniform group, you’re overlooking a lot of variations that different racialized groups are experiencing,” said lead author Dr. Amanda Giang, an assistant professor at the Institute for Resources, Environment and Sustainability and department of mechanical engineering at UBC. “For instance, in the city of Vancouver racialized communities as a whole are not experiencing higher cumulative air pollution burdens than white residents, but if you look within that, we find that Indigenous, Black, Arab, and West Asian residents are, amongst other groups.”
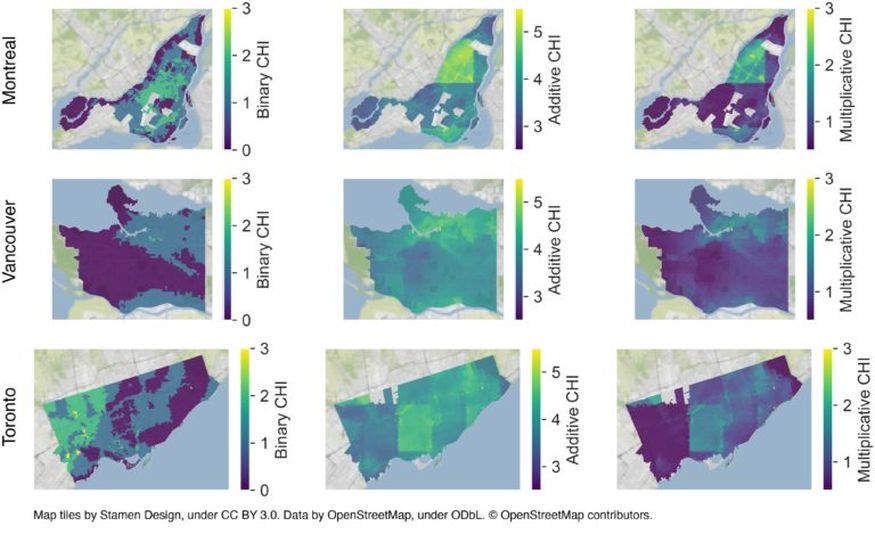
Historically, neither scientific analysis nor Canadian policy-making have been good at grappling with the cumulative nature of environmental impacts. A key contribution of the study is the development of cumulative indicators of air pollution hazard, pulling together data on pollutants including fine particulate matter, nitrous oxide, sulfur dioxide and ozone.
The researchers highlight that because people are exposed to multiple air pollutants at the same time, it is important to consider the cumulative health impacts of exposure to different pollutants. “When we talk about regulations or standards, it’s often on a pollutant-by-pollutant basis. The cumulative indicators we explored are one way we can start to think about disparities in exposure to cumulative hazards for air pollution,” said co-author Kaitlin Castellani, who was a research assistant in the Institute for Resources, Environment and Sustainability at the time of the study.
Other key findings include:
- Out of the three cities examined in the study, Vancouver has the highest relative differences between socially advantaged and disadvantaged groups for individual pollutants and cumulative air pollution indicator score.
- In Vancouver, Indigenous and low-income residents are highly concentrated east of the downtown core – areas which have higher cumulative air pollution indicator scores due to the presence of industry, marine and rail terminals and associated traffic.
- In both Toronto and Vancouver, the highest proportions of racialized residents tend to be located in the inner suburbs. These areas correspond to regions of higher ozone in Vancouver, and high sulfur dioxide in Toronto, but are more mixed for the other pollutants.
- In Montreal, the eastern portion of the city contains areas with high proportions of immigrant and racialized residents. These areas have higher cumulative air pollution indicator scores due to the confluence of industrial and traffic-related pollutants, and photochemically produced ozone.
The findings add to existing studies that show that while Canada is one of the few countries that meet World Health Organization (WHO) air quality guidelines, the areas of the nation that experience higher levels of air pollution are associated with adverse health effects. Dr. Giang points to Health Canada estimates which show that air pollution contributes to 14,600 deaths and 2.7 million asthma symptom days a year.
Inequity is part of the climate crisis
“Inequity is part of the climate crisis,” said Dr. Giang. “Many sources of air pollution are also sources of greenhouse gas emissions.” She indicated that truly just environmental policy making should center equity by considering multiple aspects of social vulnerability and environmental hazard using cumulative indicators, place-based methodology, and foregrounding the perspectives of communities impacted by pollution. These direct assessments of climate policy might ensure that what is done to advance carbon futures does not exacerbate existing inequities.
Learn More
Read about the Rapid Air Improvement Network (RAIN), a project led by UBC experts to tackle air pollution.
A version of this article first appeared on the UBC News website.